W O R D M A P
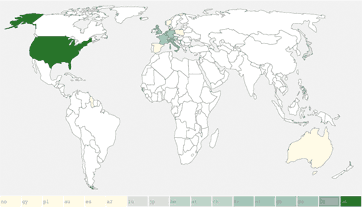
Word Map is an Internet map that combines language geography and server geography. By entering a word in the dialog box the IP addresses of the first 100 hits of the search engine Google are identified by means of geo-location and attributed to the respective countries. As the indexings of the search results show up regional concentrations and censorship-related differences, the search via google.com or via the respective Google national portal becomes possible. The analysis of the results is then depicted, on Word Map, by way of different colours and is quantifiable thanks to a map legend.
Due to global migration and cultural virtualisation linguistic maps, that correlate languages and cultural spaces, are up against certain limitations. Words are to be found less and less on the tip of the tongue and increasingly on servers. While linguistic maps analyse the frequency of languages across regions, at a specific moment in time, Word Map is a dynamic instrument.
Word Map draws up maps that are global snapshots reproducing, through geographic localisations of data ressources, the distribution of technical infrastructures, media attention and linguistic phenomena. The question, which servers in which countries which terms are situated at, and what relevance is attached to them by search algorithms, by going well beyond linguistics, turns out to be a matter of both politics and economics. Although the identification of data spaces with specific national territories contradicts the Internet as a global and cross-border knowledge space, Word Map opens up a new perspective on the distribution and the accumulations of digital ressources, on attention economies and not least on the alliance between information and capital. The ‘seventh continent’ of the Internet, from a geographical point of view, reflects the state of geo-political tectonics.
Colour Chart Painting
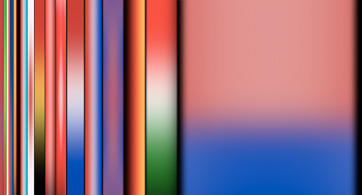
Colour Chart Painting is a sort of cartographic painting that turns the analytic results of Word Map into the material of images. The term entered becomes the image title of an algorithmic painting that generates the data landscapes of the Internet. In keeping with the logics of charts and the tradition of colour field painting the number of hits determines the percentage of the image area taken up. The colour combinations are based on the national colours of the respective countries.
Between painting and cartography there exists an old kinship that identifies maps as a special sort of paintings and painting as a special type of cartography. Ptolemy defined geography as ‘an imitation through drawing of the entire known part of the world together’. Accordingly, the Internet is an imitation of the world through all parts of the known data and images. In Colour Chart Painting the Internet becomes the painter’s palette and the server becomes a painting machine.


